AIR PRESSURE & ALTITUDE GRAPH
BARO-GRAPH
Graph air pressure with second-by-second resolution and compare vs. GPS altitude. Originally developed for aviation, great for everything from hiking to weather tracking.
High reliability and full resolution data with no extra fluff. Originally designed for aircraft cockpit pressurization system diagnostics - exactly what you want for everything from hiking to weather tracking as well.
NOTES:
- Compatible with iPhones and iPads that have the built-in barometer: the iPhone 6 and later (excluding the iPhone SE), and iPad Air 2 and later.
- Remember to quit app when you don't need to record data, running the GPS in the background uses battery.
HIGHLIGHTS:
- Graph can be zoomed all the way in to see each individual data sample and all the way out to see the full recording
- Export CSV file and send via email for storage and later analysis
- Continuous recording in the background (to stop recording quit the app)
APPLICATIONS:
- Aviation cockpit/cabin pressurization system diagnostics
- Aviation pressure altitude (for non-pressurized aircraft)
- Hiking elevation gain/loss
- Athletics elevation gain/loss and air pressure tracking for altitude training
- Weather tracking and forecasting
MORE DETAILS:
- Records from the barometric pressure sensor as well as the GPS radio
- Display units: kPa, "Hg, and 'Pressure Altitude' in feet
- Time displayed in 'Zulu' military time (same as UTC time zone)
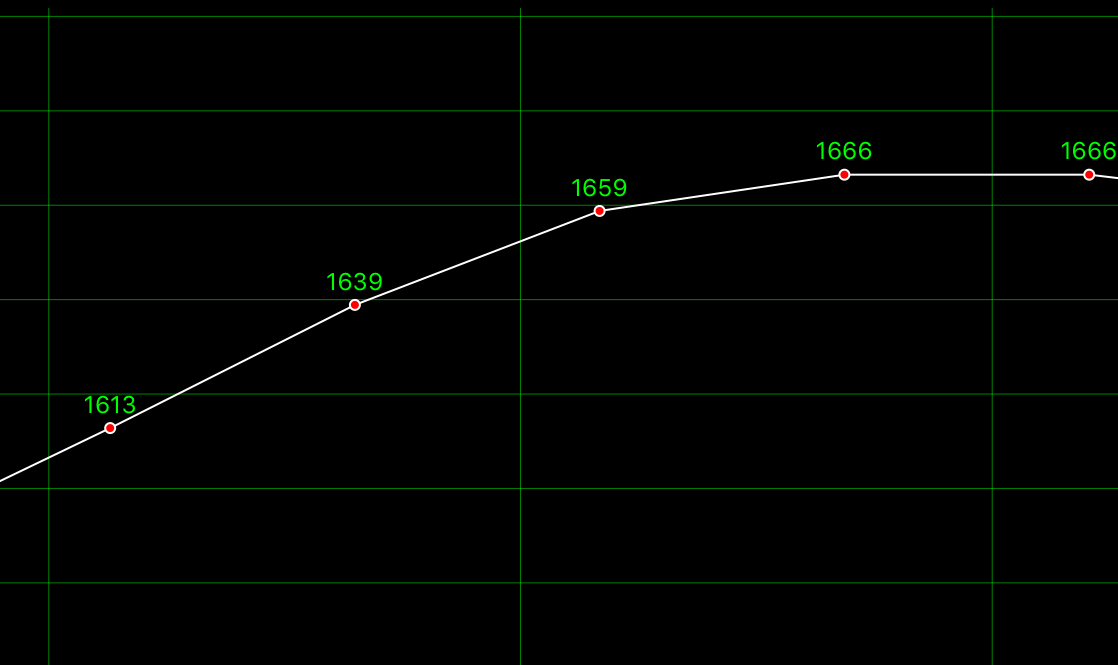
- Graph shows most recent 48 hours of data
- Pressure sampled as often as the device supports (~1Hz)
- GPS altitude sampled as often as the device supports (~0.1Hz)
Most other apps will not record continuously when in the background. They intermittently stop recording for periods of time to save battery. This app prioritizes continuous recording as it is designed for critical data capture and display. To save battery simply quit the app when not in use.
Most other apps only show a basic overview graph and do not enable you to zoom all the way in to a specific section of recording to see individual samples. This app does enable zooming in and out freely to evaluate any fast pressure rise or fall in detail.
For reference, here pressure altitude feet defined as
feet = ( 1 - (millibars/1013.25)^0.190284 ) * 145366.45
which is the same as height in feet above the standard datum plane of 29.92 "Hg.